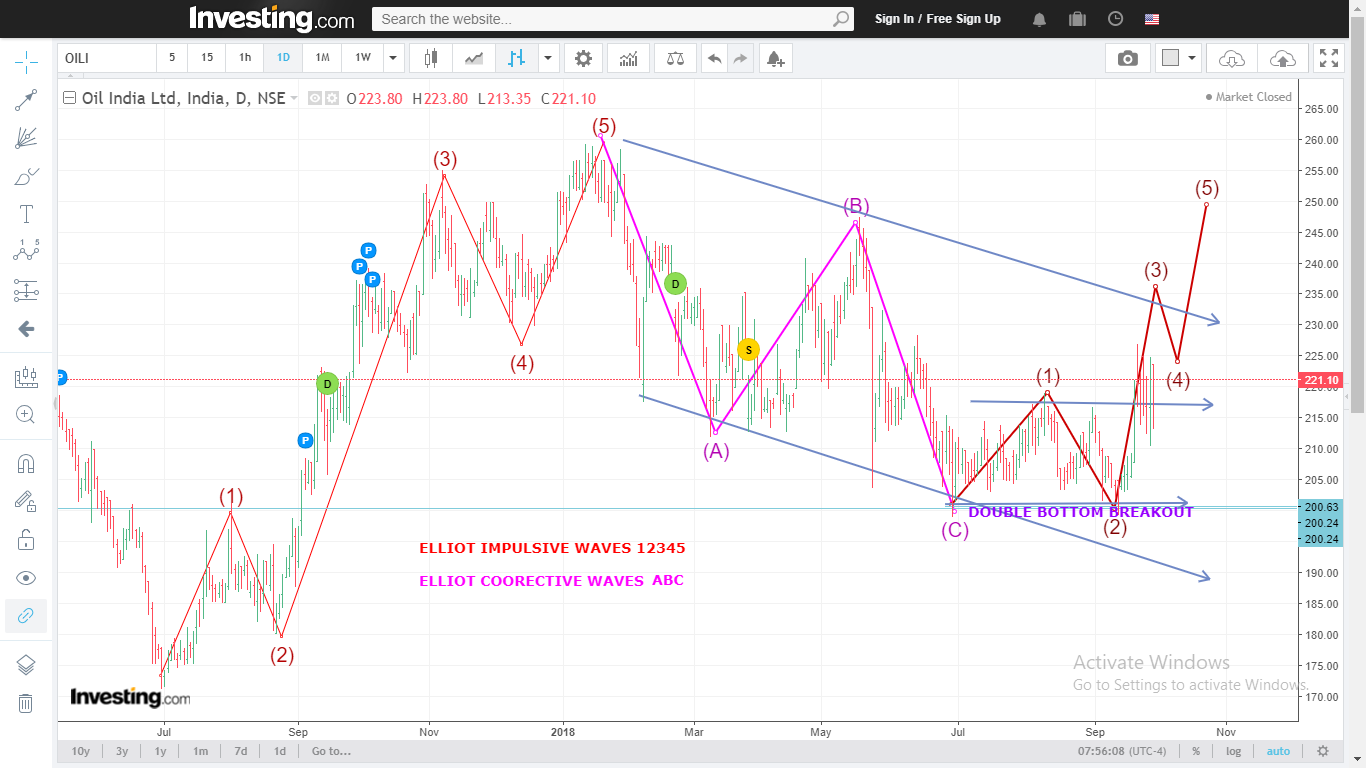
OIL INDIA TRADING IN ITS THIRD WAVE. BUY FOR 10-15% RETURN FOR OCTOBER SERIES
OIL INDIA COMPLETE TECHNICAL ANALYSIS FOR OCTOBER SERIES 2018:
TECHNICAL OUTLOOK:
OIL INDIA currently looks that it has started its third wave.
DOUBLE BOTTOM breakout on daily charts observed..
Trading above its 200 weekly EMA and SMA.
BULLISH CANDLESTICK PATTERN on weekly charts..
Fundamentally speaking ,the stock price is going to take support from the rise in crude oil prices as the company is in manufacturing and filtering business…
Here is the snapshot..
———————————————————————————————————————-
